How to Use the Query Data Tool
Use the Query Data Tool to identify geographic areas that meet, exceed, or fall below data thresholds of your choosing. In addition, the Query Data Tool serves as a means of converting Map Room data into tabular form, downloadable as a .csv file. This tool is available to all SparkMap users.
Select a Layer to Query
Run Your Query
Explore and Export Your Queried Data
Step 1 – Select a Layer to Query
The Query Data Tool is only accessible once you add a map layer to the Map Room.
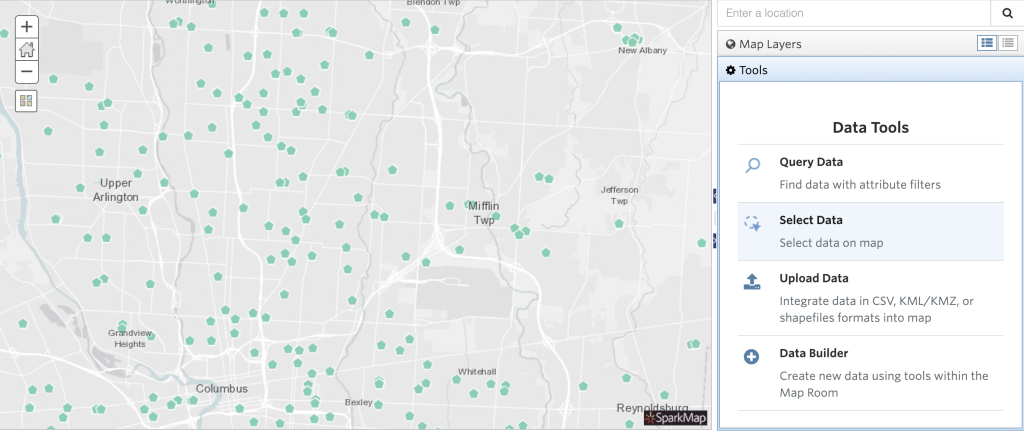
Once you’ve added your layer and zoomed into your location of interest, access the Query Data Tool by clicking the “Tools” tab and scroll to the “Query Data Tool” heading (Figure 1).
Step 2 – Run Your Query
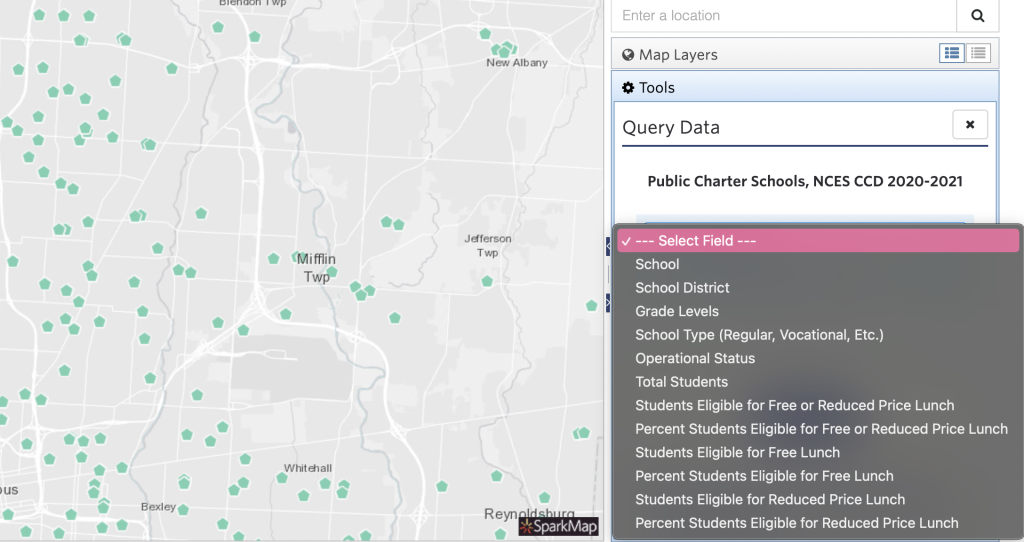
Click the “Select Field” box (Figure 2), and a list of your map layer’s data attributes will populate.
For example, the “Public Charter Schools” map layer contains data on each school’s name, school district, grade levels, school type, operational status, number of students, and more.
You cannot query every attribute of a map layer simultaneously – this would produce an overwhelming amount of information!
Instead, click to select one field in which you are interested, such as number of students.
Once you select your field, the value buttons may change depending on the field you selected. They might read “contains” or “equals,” or they might provide a set of symbols (=, >, <).
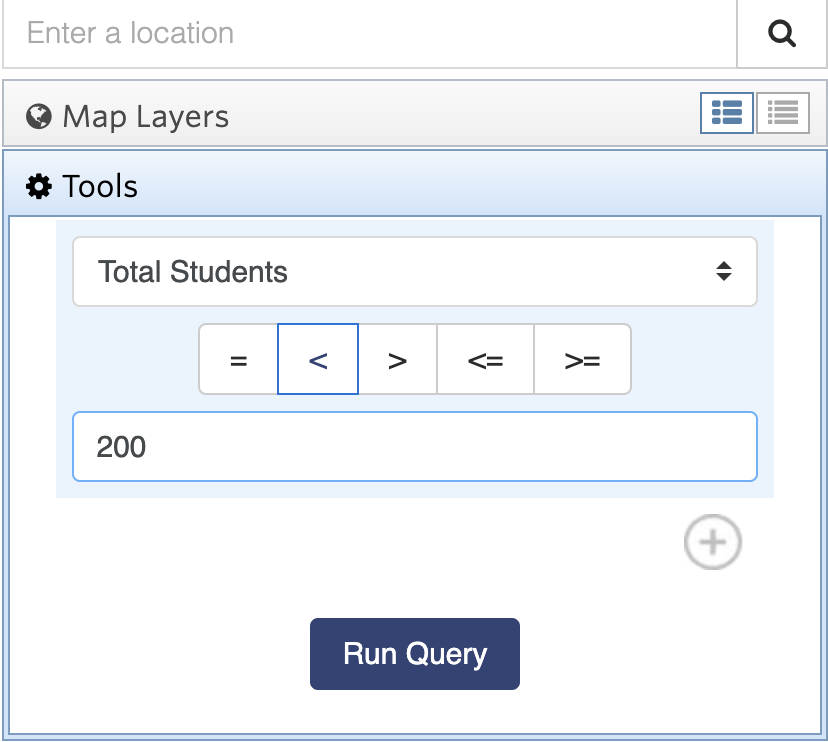
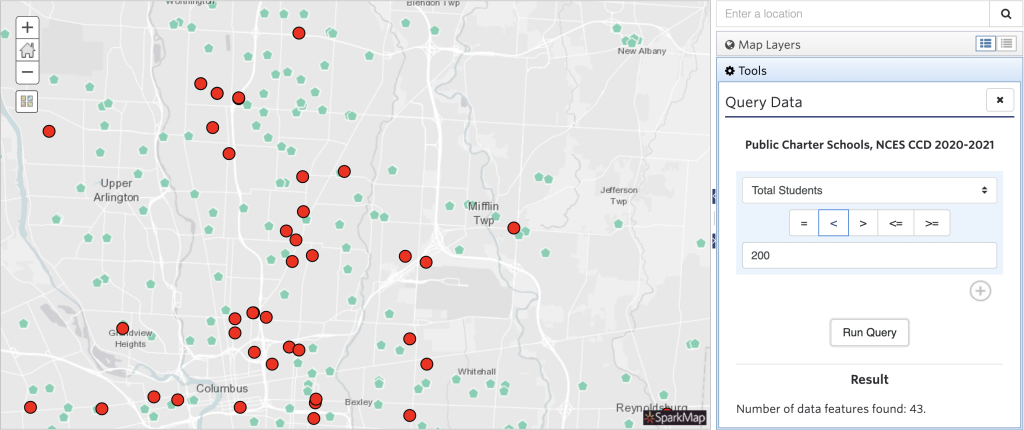
Select the appropriate word or symbol and enter your value of choice (Figure 3).
Example 1: If I am looking for elementary schools in my area, I would select “Grade levels” as my field, press the “contains” button, and then type “elementary” in the following space.
Example 2: If I am looking for schools in my area with less than 200 students, I would select “Total students” as my field, press the < button, and then type “200” in the following space.
Press the “Run Query” button to run your query.
Step 3 – Explore and Export Your Queried Data
The locations meeting the requirements set in your query will now be identified in your map (Figure 4).
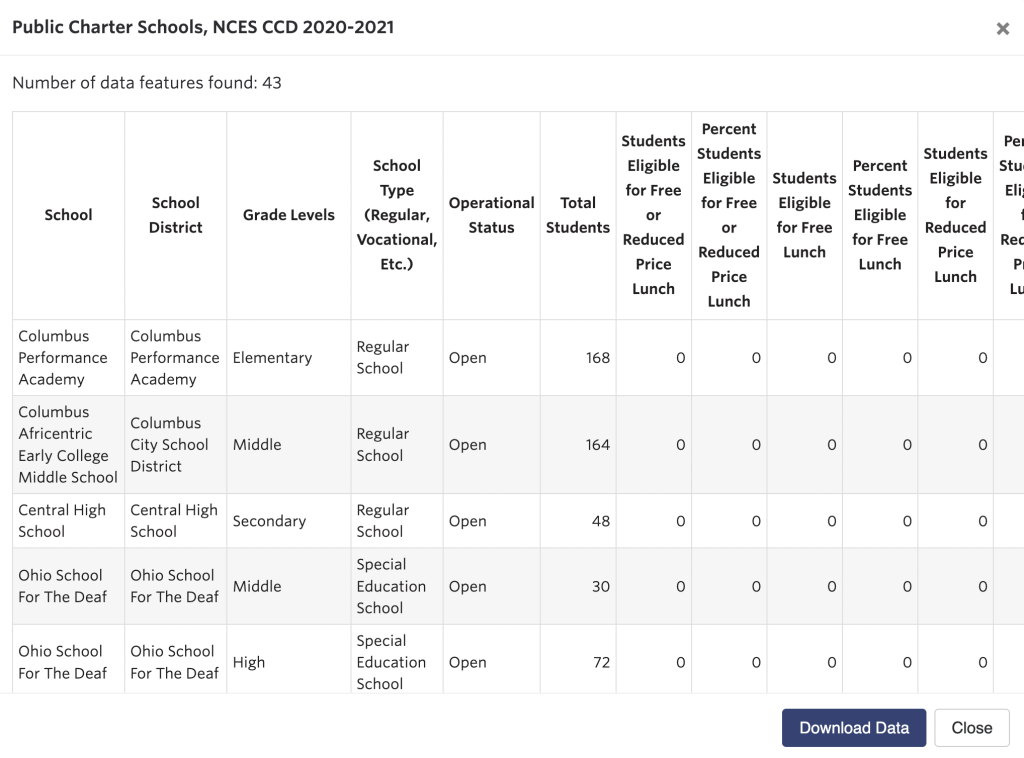
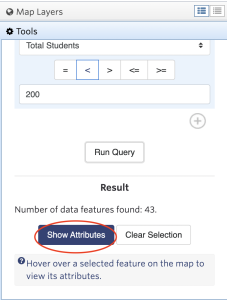
To view the queried data visible on your map in tabular form, select the “show attributes” button (Figure 5, circled in red).
To download your attribute table as .csv file, select the “Download data” button (Figure 6).