Non-Profits
Non-Profit organziations nationwide use SparkMap to identify and justify needs in their service areas, plan programming, and quickly produce robust CNAs and grant applications.
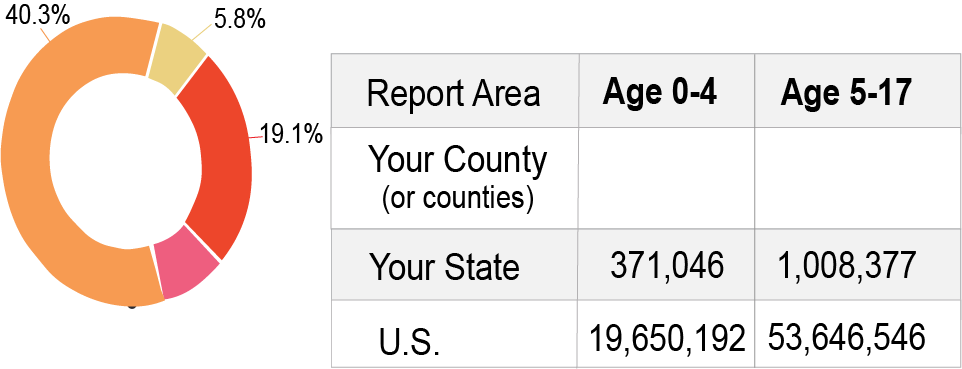
Need Data on Vulnerable Populations? SparkMap’s Community Needs Assessment Can Help
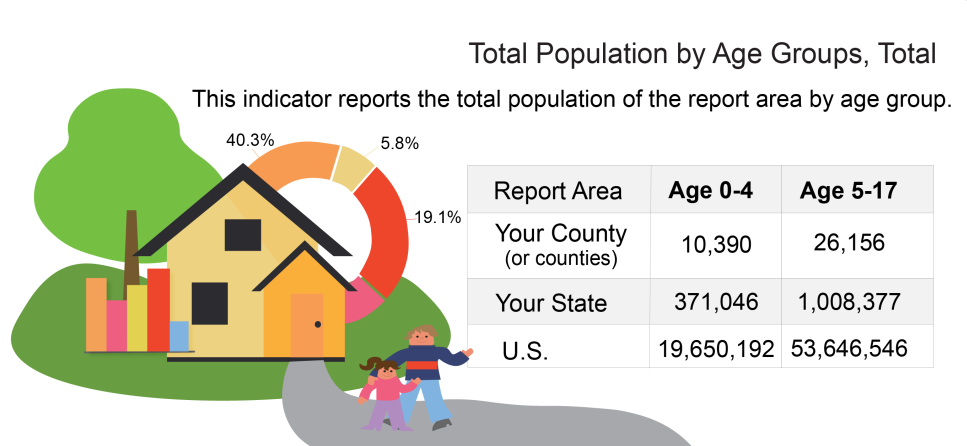
Most professionals working with nonprofits utilize SparkMap’s Pro or Premium Subscription to access hard to find community-level data on topics such as homelessness, socio-economic vulnerabilities, and community health. They use these data to identify areas for programming and outreach opportunities, make data-informed spending plans, and supplement grant applications and community needs assessments. Click the buttons below to learn more.
Looking to Explore and Map Community Resources? SparkMap’s Map Room Has All the Data You Need
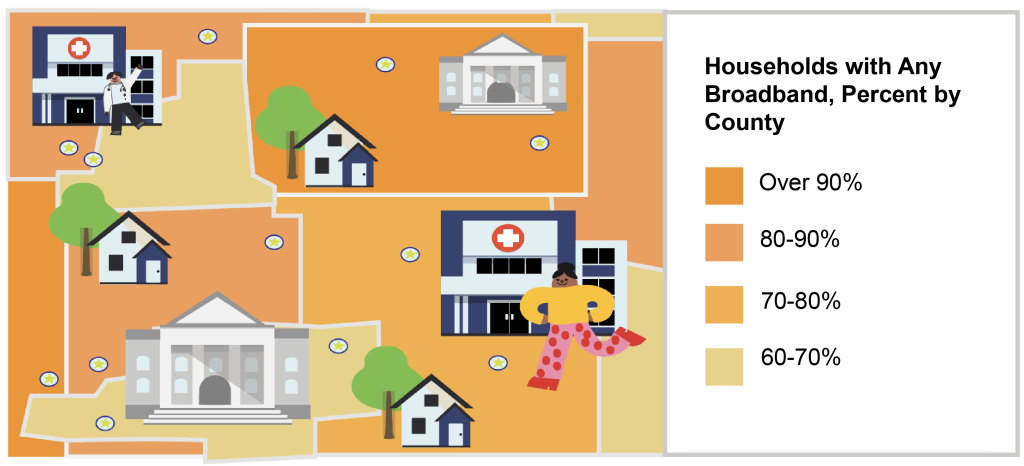
Many nonprofit workers use the Map Room’s suite of footprint tools to quickly identify vulnerable populations at the community level.
In addition to footprint tools, the Map Room is well equipped with interactive, buildable map layers on topics ranging from food access to infrastructure availability. Nonprofits use these data to identify community needs, justify funding proposals, and spur community change. To further this end, many also layer SparkMap’s data with their own data (i.e. pop-up food pantry locations) using the data upload feature available to Pro and Premium subscribers. Click the buttons below to learn more.

Find the Data You Need to Help Identify Service Needs and Spur Positive Change
Our relevant data sources include:
Our relevant data categories include:
View all 100+ SparkMap data sources and all 300+ indicators on our Community Needs Assessment Indicator List. View our 28,000+ map layers in our Map Data List.
Explore Use Cases from Non-Profits Using SparkMap
Education Programs

Food Services
Grant Applications
Housing and Homelessness Services

Supporting Economic Mobility

Supporting Youth and Families

Check Out Our Topic-Based Non-Profit Community Needs Assessments and Maps