Blog
Agriculture Civil/Social Community Needs Assessment Data Economic Education Environment Health How To Map Room Product Updates Reference Special Topic

Air Quality Data is AWESOME
This is a post about air quality data!
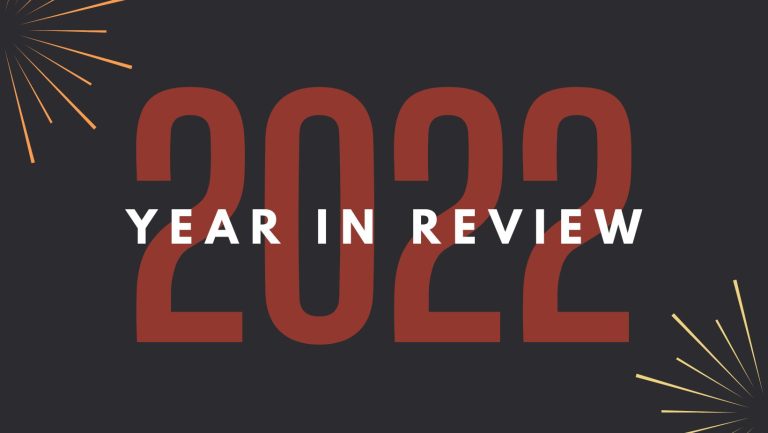
SparkMap’s 2022 in Review
2022 was a big year at SparkMap, thanks to you! Internally, we added more members to our team, underwent a full site refresh to unveil in 2023, and developed more multimedia content to enhance your SparkMap experience. We weren’t the only ones busy on SparkMap this year! In our 2022 Review, we’ll Thanks for…
Tracking Data Trends Over Time: Enhancing Data Literacy pt. 3
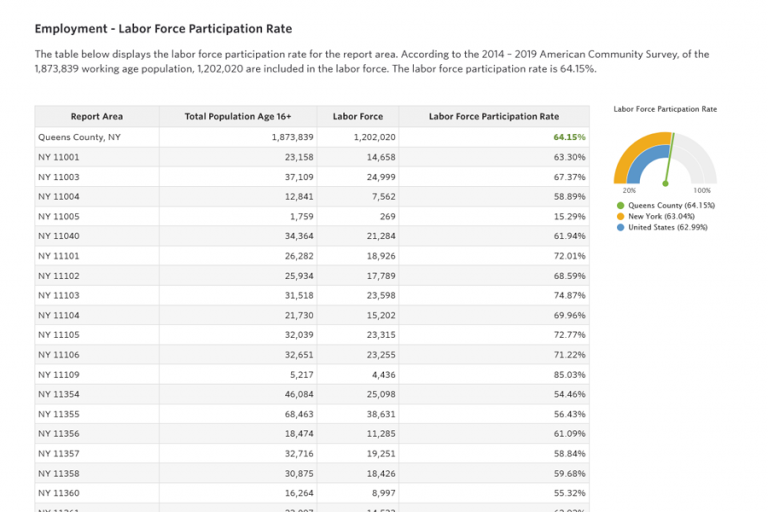
Focusing on trends in data over time is interesting and impactful. Understanding which job sectors have grown in the last five years, illuminating areas of increased health disparity, or tracking migration patterns within the country are important for community development, resource allocation, and legislative efforts. While it’s easy to assume data from the same sources…

Will you survive the Zombie Apocalypse?!
Can you survive the Zombie Apocalypse? Using the Map Room, chart your route to the nearest hospital, supermarket, drug stores, and warehouse stores to ensure you can get supplies. Find out how!

Where’s the Food? Part 1: Finding and Using Data on Food Retailer Locations
Whether you work in healthcare, community planning, or community improvement programs access to reliable food is a must. In this blog series we highlight different food layers available on SparkMap and how they can be used to benefit your community.
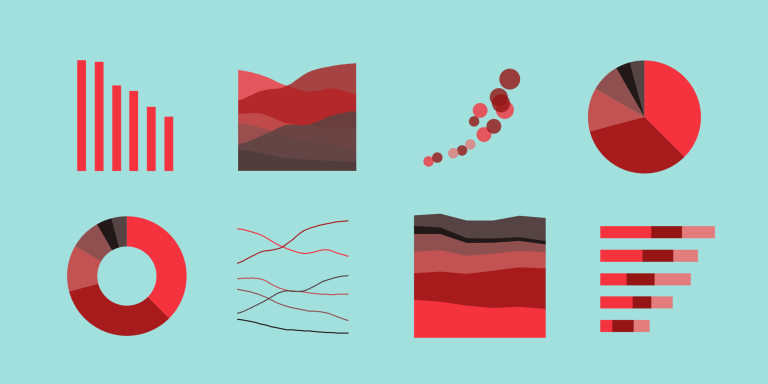
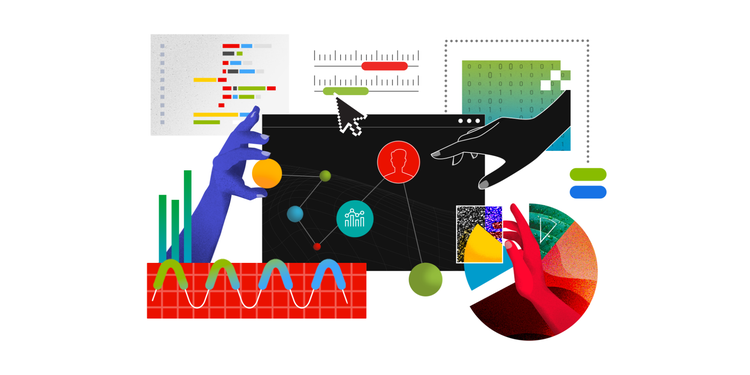
4 Ways to Enhance Your Data Visualizations
In this piece, we consider some of the best practices of data visualization and offer 4 key tips to improve your data viz usage.

Public Education Funding and Student Outcomes
The debate around public education funding and student outcomes is longstanding. In this blog, we discuss important background information on where SparkMap’s public education revenue and expenditure data comes from, what it covers, how it is linked to student outcomes over time, and how you can use SparkMap to dive into the link between public education expenditures and outcomes in your community.

Enhancing Data Literacy pt. 2: Interpreting Maps
Creating lasting change in your community is only possible when you have an accurate understanding of its strengths and needs. In other words, you need community-level data in order to determine outreach needs, pinpoint service areas, and identify areas in which your community already excels. We believe the best way to do this is through…

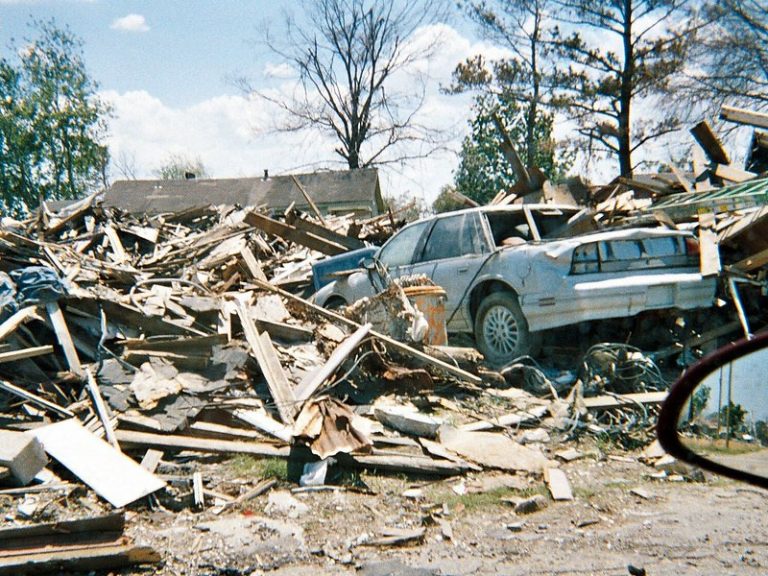
My World’s on Fire, How ‘Bout Yours?
In this blog, we highlight frequently updated wildfire and drought data layers. Whether or not your community is directly impacted by wildfire season or drought, our climate data can help you stay safe and spur positive community resilience.

Enhancing Data Literacy with SparkMap
At SparkMap, we’re passionate about impacting communities based on high-quality data. Since you’re here, you probably feel the same way. However, we know that understanding and applying data can be tricky. So, we’re starting a blog series dedicated to the foundations of data literacy. Through this blog series, we hope to empower you by enhancing…

The National Crop and Commodity Production Index
The NCCPI is a robust and valuable dataset – learn more about it and how to access it on SparkMap.
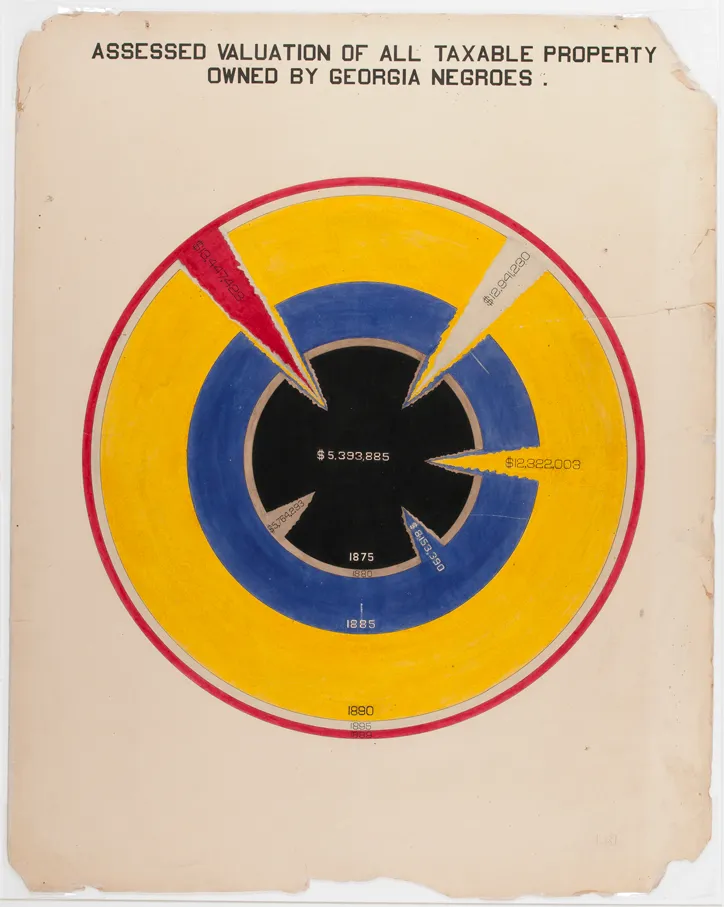
W.E.B. Du Bois & Data Visualization History
In this blog we discuss history of data visualization with a particular focus on the fascinating work of W.E.B. Du Bois.
American Community Survey 2016-2020 data has arrived! Here’s what you need to know.
We have updated the American Community Survey (ACS) 5-year estimates on SparkMap! Read more about what the ACS is, what exactly has been updated on SparkMap, and how these changes impact you.

The Health, Environmental, and Economic Impacts of Commuting
Commuting to work has significant impacts on personal health, the environment, and the economy. Learn more with SparkMap data in this blog!

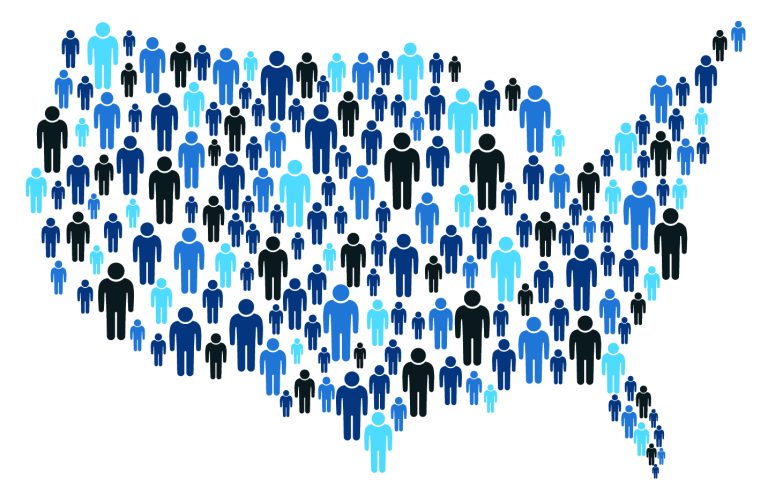
Advancing Demographics: Expanding Race and Ethnicity Measures in the US Census
The US Census Bureau has undergone changes in their demographics questions. Why are these changes needed, how do they demonstrate the changing population of America, and what can we do with this information? Find out in our blog!
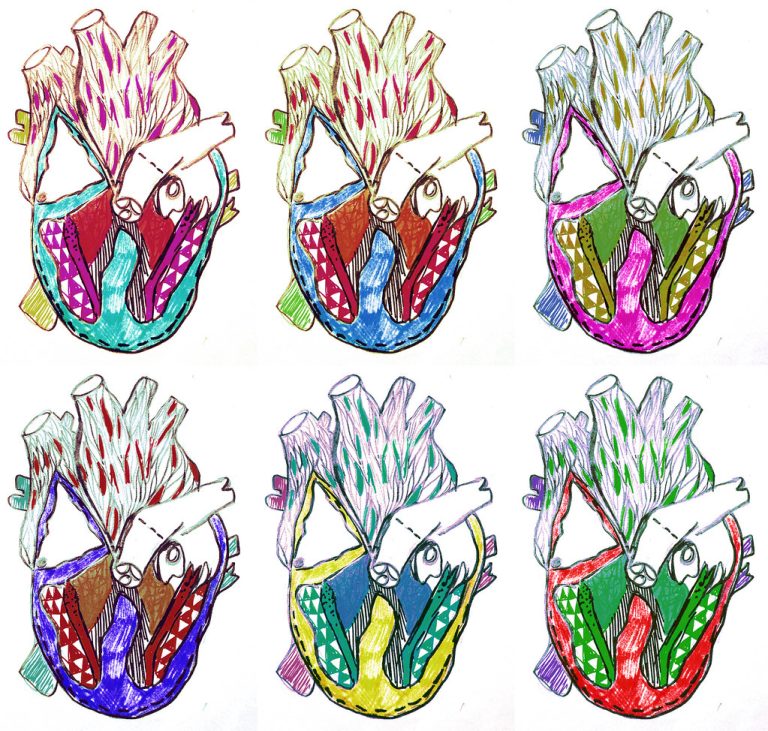
Heart Disease – Designing Community Interventions
Heart disease is the leading cause of death in the United States. How can we use maps and data to understand where our most at-risk communities are and what interventions may help?

Building a Multi-Layer Map: Part One
In this blog series, “Building a Multi-Layer Map” we will explore answers to core map-making questions, unpack some best practices, and highlight how you can use SparkMap to tell a story, rooted in data, about your community.

A Year in Review: Looking Back & Gazing Ahead
In this blog we take a look back at all that you accomplished in 2021 and preview what’s to come in 2022. Thank you for being part of SparkMap. We can’t wait to see what you create this year!

Hyperlocal data in the Map Room – looking for Nonprofits near me
Learn how to use the Select Data tool in the Map Room to see data in context of a specific region or distance from a point. In this example, we’ll look at the data for 501(c)(3)s and (c)(4)s that are within 1 mile of an address.
Community Assessment 101
Our Community Assessment tool provides those in healthcare, non-profit, and local governments with the data they need to make reports highlighting community needs and areas for improvement. Let’s create a Community Assessment in 6 easy steps!

Diabetes: Assessing Risk Amidst the Pandemic
People with Type 1 and Type 2 diabetes are more likely to develop serious cases of COVID-19, including hospitalization, than those who don’t have diabetes. But, how can healthcare providers identify those with diabetes and determine strategies to support them? SparkMap can help!
Map Room 101
Use the Map Room to tell the story of your community in a compelling and visually interesting way. Learn how to add data to a map and explore some basic ways to understand that data.

Selecting Data for a CHNA: Five Best Practices
Community Health Needs Assessments (CHNAs) have evolved in many ways over the last ten years. We’re excited to share 5 best practices we’ve learned for selecting CHNA data.

Choosing the Right SparkMap Product for You
What brought you to SparkMap? Was it our mission to bring you all the data you need, ready to go, all in one place? Was it the 279 indicators you can use to create Community Assessments? Or, perhaps you were interested in using our Map Room to tell the story of your community through some…

New Census 2020 Redistricting Data Available!
On August 12, the U.S. Census Bureau released the most comprehensive set of data yet from the 2020 census. Demographic data was released at the “census block” level, which is the smallest unit of geography the census defines for public use (see below resource for more information) .

COVID-19 in Your Community: Get the Latest Data
As we witness COVID-19 variants sweep through the country, we recognize that data for decision-making is more important now than ever. Learn more about what’s happening in your world with data around COVID-19 Vulnerability, Vaccinations, and Hospitalizations.
FEMA National Risk Index
What are the riskiest disasters that communities should be prepared for and where should resources be allocated? The Federal Emergency Management Agency (FEMA) released a new index – the National Risk Index – to help communities mitigate disasters with more specificity.
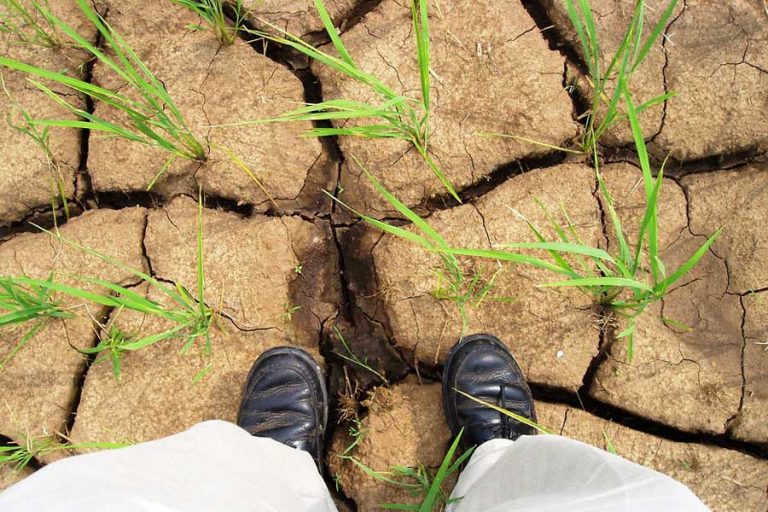
U.S. Drought Monitor (or, It’s a Dry Heat)
One of our frequently updated datasets, Drought Intensity from the U.S. Drought Monitor, is unfortunately coming into greater use as drought conditions intensify across the United States. Learn more about the dataset and it’s uses.

Environmental Data and Park Access
Research, and personal experience for many, has shown the positive relationship between time outdoors and our physical and mental health. Learn how to use the Map Room to access environmental data and make the case for parks in your community.

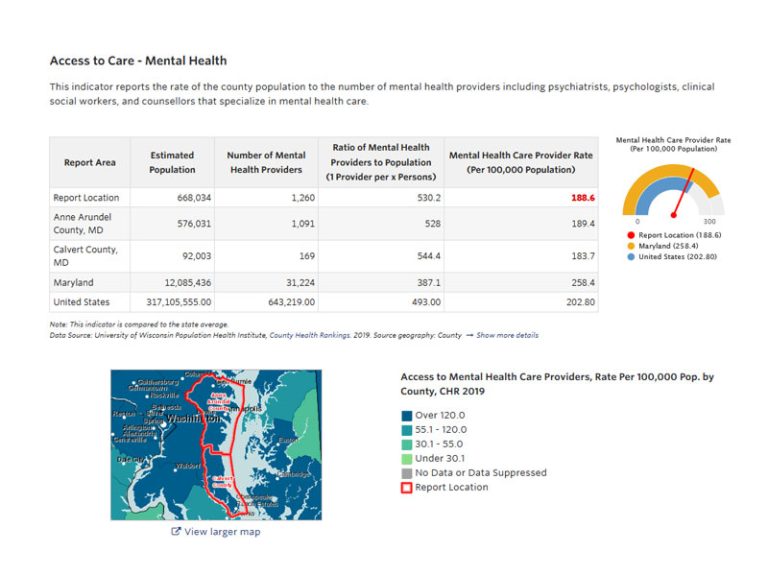
Understanding Access to Mental Health Resources
In order to maintain positive, long-term mental health outcomes in communities around the nation, organizations and governments need access to up-to-date, reliable, and accurate data to effectively allocate resources, programs, and training opportunities for those who need it most. Read this blog to learn how to use SparkMap tools and resources to build a case for funding.

The American Rescue Plan Act
With a relatively sudden influx of federal dollars for communities to allocate, it will be crucial for decision makers to use relevant and reliable data to make informed decisions. SparkMap’s data and analysis platform is a crucial resource for helping local governments identify the needs of their communities.
ZIP Code Data Now Available in the SparkMap Assessment
For the first time ever, SparkMap is offering ZIP code breakouts for nearly 100 of our indicators. Get data for every ZIP code in your assessment area – view alongside our dynamic data visualizations or download for offline use.
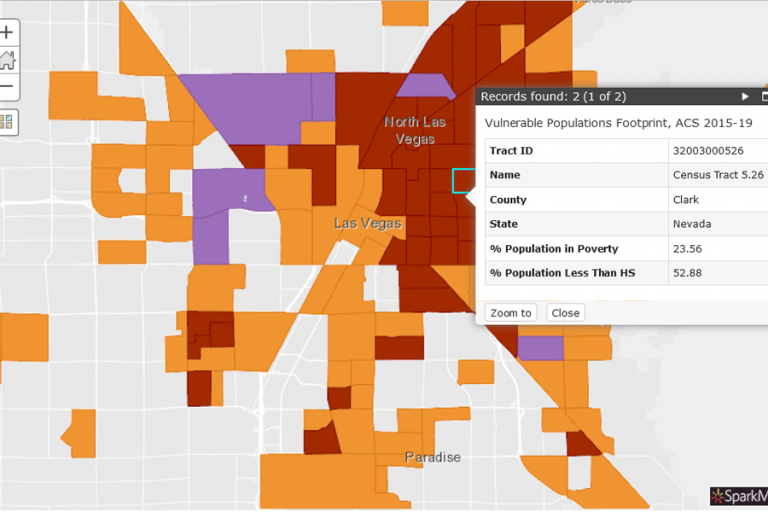
Explore the intersection of poverty and education: SparkMap’s Vulnerable Populations Footprint Tool
Identify Vulnerable Populations with the SparkMap VPF Tool and help change health outcomes in the communities you care about.

COVID-19 Spread and Long-Term Consequences
COVID-19 has severely affected the economy, health, and mental well-being of every community around the United States. SparkMap provides real-time data sharing, analysis, and visualization—key strategies for an equitable and speedy recovery. This blog shows how our map and assessment tools are used to understand COVID-19 cases and its consequences.

To Avoid Gender Bias, We Need Sex-Segregated Data
Are you focused on expanding, understanding, or analyzing women’s opportunities in the economic sector, do you want to support the implementation of gender-focus policies in the US or at the local level? Learn about how you can access sex-aggregated data on this week’s blog in honor of Women’s History Month.

BRFSS Demystified
If you’ve existed in the health space for any period of time, you’ve probably heard of BRFSS data, but what is it, really?
Learn more about the importance of the Behavioral Risk Factor Surveillance System.

Announcing the SparkMap Blog!
Welcome knowledge-seekers, problem solvers, and changemakers!