Air Quality Data is AWESOME
This is a post about air quality data!

This is a post about air quality data!
Focusing on trends in data over time is interesting and impactful. Understanding which job sectors have grown in the last five years, illuminating areas of increased health disparity, or tracking migration patterns within the country are important for community development, resource allocation, and legislative efforts. While it’s easy to assume data from the same sources…
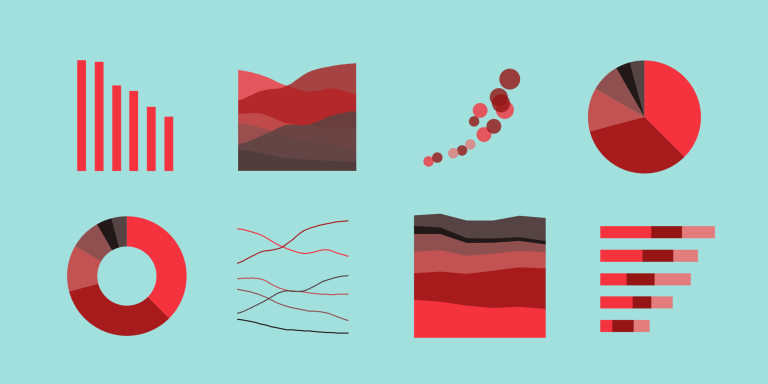
In this piece, we consider some of the best practices of data visualization and offer 4 key tips to improve your data viz usage.

The debate around public education funding and student outcomes is longstanding. In this blog, we discuss important background information on where SparkMap’s public education revenue and expenditure data comes from, what it covers, how it is linked to student outcomes over time, and how you can use SparkMap to dive into the link between public education expenditures and outcomes in your community.
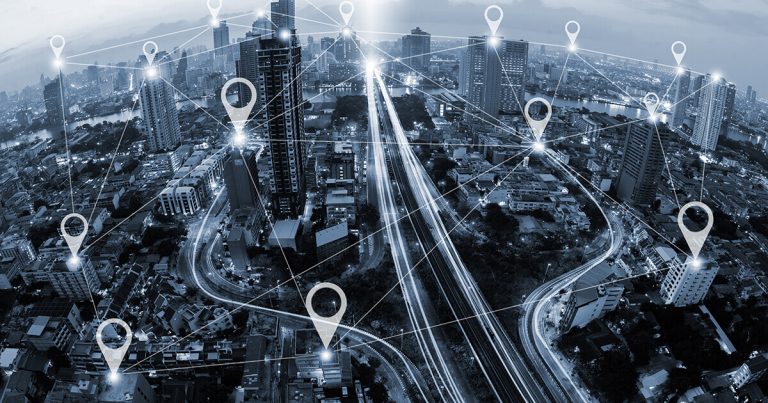
Creating lasting change in your community is only possible when you have an accurate understanding of its strengths and needs. In other words, you need community-level data in order to determine outreach needs, pinpoint service areas, and identify areas in which your community already excels. We believe the best way to do this is through…

In this blog, we highlight frequently updated wildfire and drought data layers. Whether or not your community is directly impacted by wildfire season or drought, our climate data can help you stay safe and spur positive community resilience.