How to Use the Community Demographic Mapping Tool
The SparkMap Community Demographic Mapping Tool can help you quickly gather information about the demographic makeup of your community of interest. The tool allows you to easily view community poverty levels, educational attainment, population, persons per square mile, gender, age, and race/ethnicity populations for your selected geography.
Access the Community Demographic Mapping Tool
Select Geography Level and Location of Interest
Generate Report
Step 1 – Access the Community Demographic Mapping Tool
Open the Map Room. Close the “Search Data” popup using the “X” in the upper right corner or the “Close” button in the lower right corner.
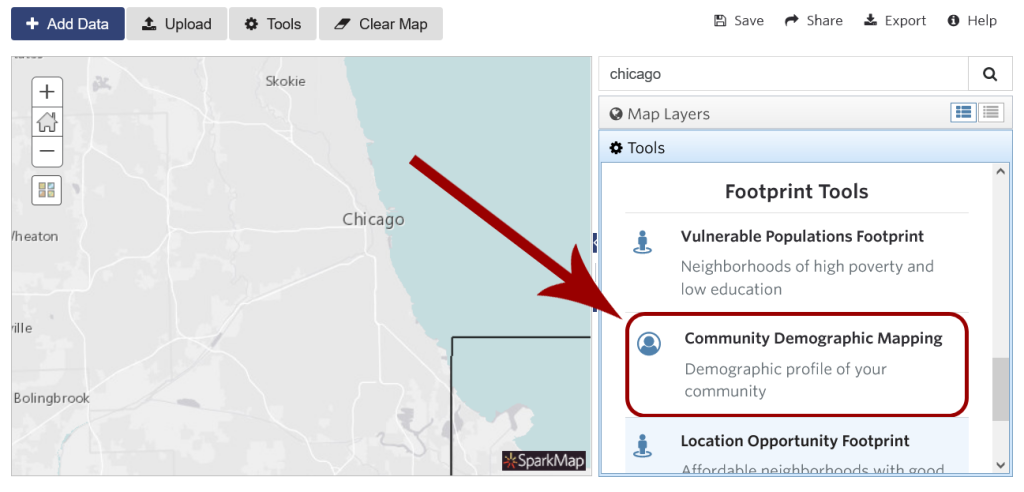
Navigate to Tools using the “Tools” button at the top of the Map Room or by clicking on the “Tools” pane on the right hand menu. Select the “Community Demographic Mapping” tool (Figure 1).
Step 2 – Select Geography Level and Location of Interest
Once you’ve opened the Tool, you’ll be asked to define your Community Area (Figure 2).
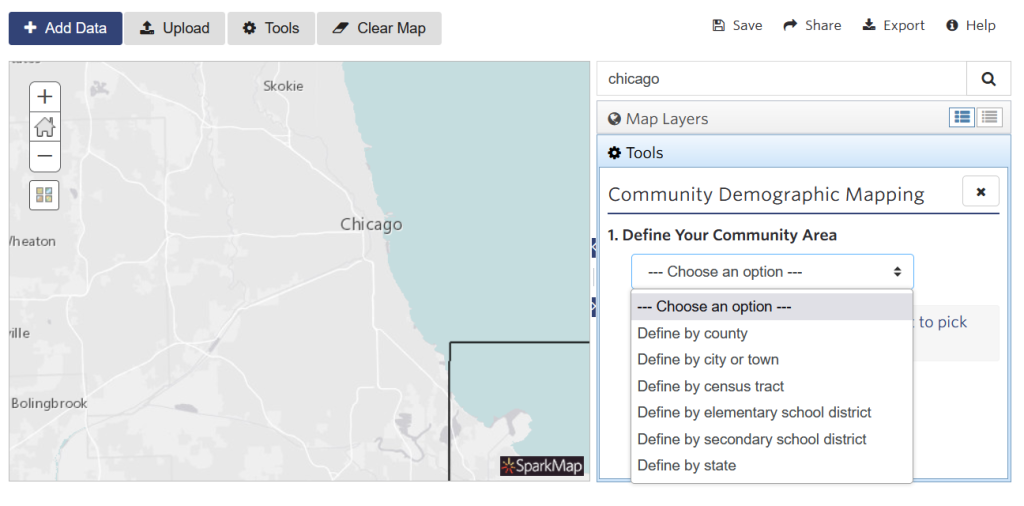
Select the type of area you’re interested in from the options presented. You can define your community area by county, city/town, census tract, elementary school district, secondary school district, or state.
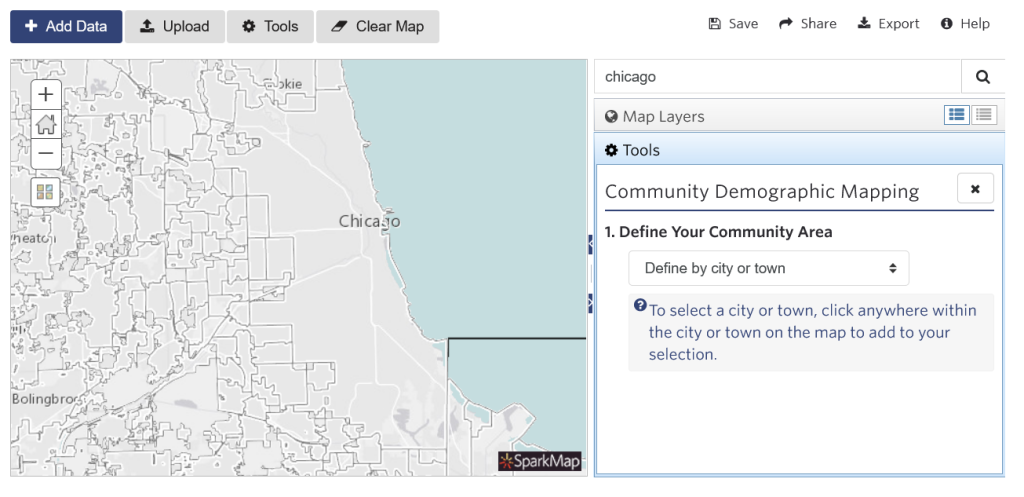
Once selected, the corresponding geographic boundaries will appear on the map as well as instructions on how to select your desired report locations (Figure 3).
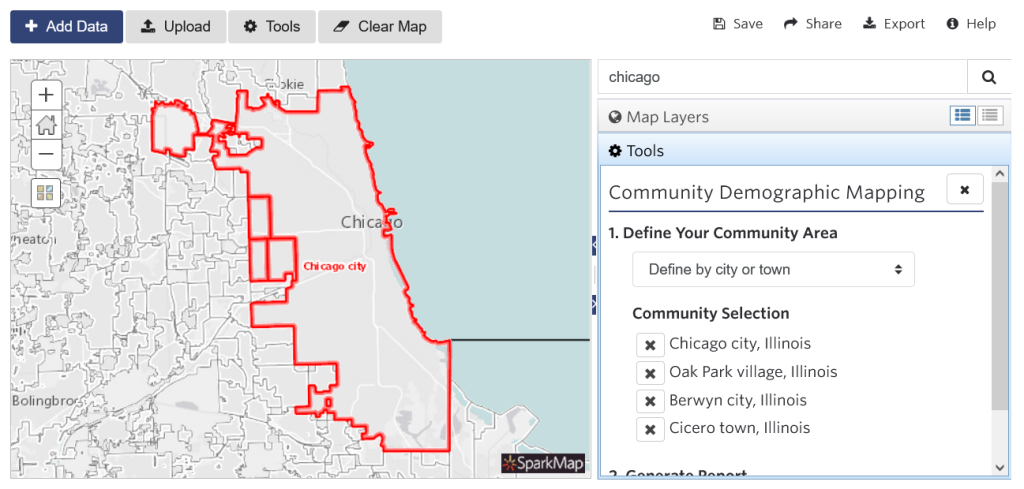
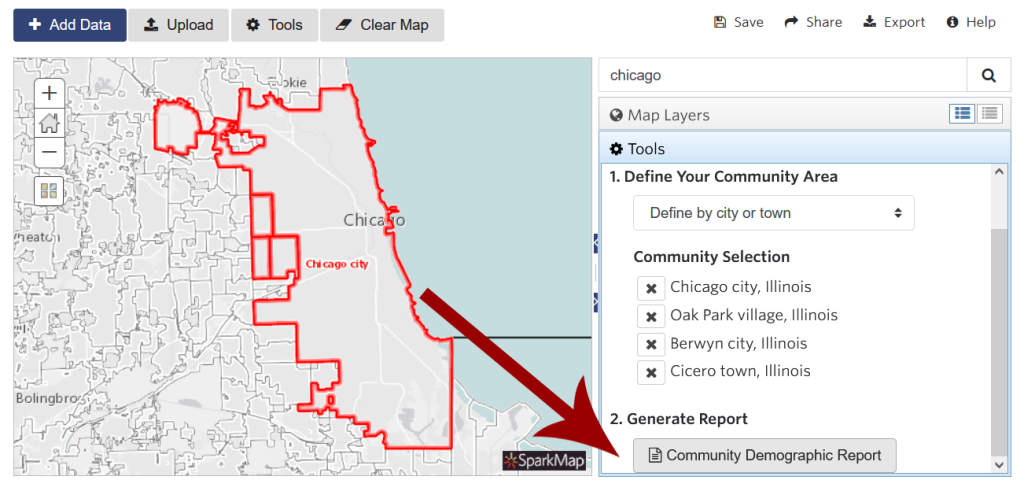
Click on one or more locations on the map to add these areas to your report (Figure 4). Click the “X” next to a selection in the tool pane to remove it from the map.
Step 3 – Generate Report
Click the “Generate Demographic Report” button (Figure 5). Your report will open in a new tab.
For a sample report (PDF), click here.
For more information on how to use the Map Room, check out our other support materials.
