Air Quality Data is AWESOME
This is a post about air quality data!

This is a post about air quality data!

In this blog, we highlight frequently updated wildfire and drought data layers. Whether or not your community is directly impacted by wildfire season or drought, our climate data can help you stay safe and spur positive community resilience.

Research, and personal experience for many, has shown the positive relationship between time outdoors and our physical and mental health. Learn how to use the Map Room to access environmental data and make the case for parks in your community.

Creating lasting change in your community is only possible when you have an accurate understanding of its strengths and needs. In other words, you need community-level data in order to determine outreach needs, pinpoint service areas, and identify areas in which your community already excels. We believe the best way to do this is through…
If you’ve existed in the health space for any period of time, you’ve probably heard of BRFSS data, but what is it, really?
Learn more about the importance of the Behavioral Risk Factor Surveillance System.
In this piece, we consider some of the best practices of data visualization and offer 4 key tips to improve your data viz usage.
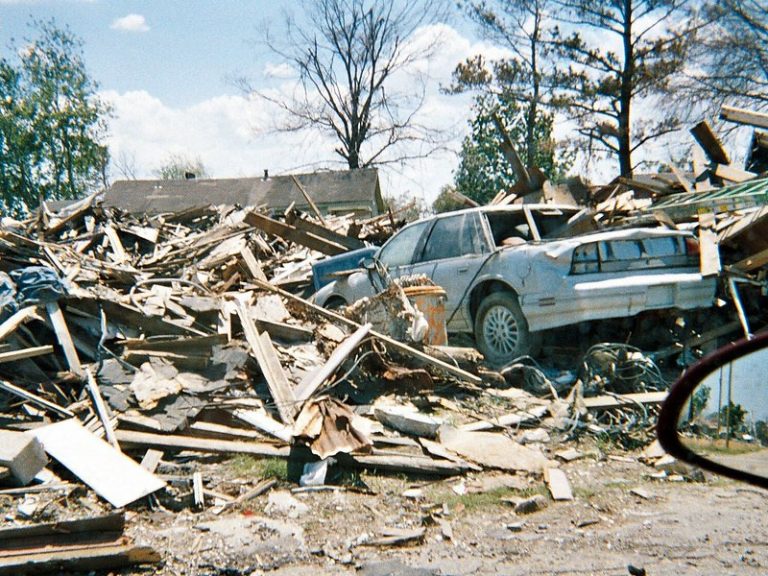
What are the riskiest disasters that communities should be prepared for and where should resources be allocated? The Federal Emergency Management Agency (FEMA) released a new index – the National Risk Index – to help communities mitigate disasters with more specificity.