Air Quality Data is AWESOME
This is a post about air quality data!

This is a post about air quality data!

On August 12, the U.S. Census Bureau released the most comprehensive set of data yet from the 2020 census. Demographic data was released at the “census block” level, which is the smallest unit of geography the census defines for public use (see below resource for more information) .
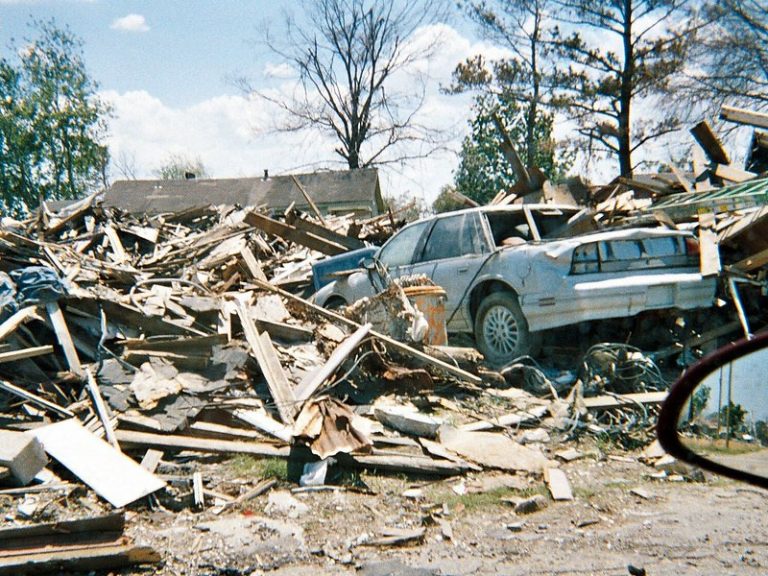
What are the riskiest disasters that communities should be prepared for and where should resources be allocated? The Federal Emergency Management Agency (FEMA) released a new index – the National Risk Index – to help communities mitigate disasters with more specificity.

Learn how to use the Select Data tool in the Map Room to see data in context of a specific region or distance from a point. In this example, we’ll look at the data for 501(c)(3)s and (c)(4)s that are within 1 mile of an address.

At SparkMap, we’re passionate about impacting communities based on high-quality data. Since you’re here, you probably feel the same way. However, we know that understanding and applying data can be tricky. So, we’re starting a blog series dedicated to the foundations of data literacy. Through this blog series, we hope to empower you by enhancing…

As we witness COVID-19 variants sweep through the country, we recognize that data for decision-making is more important now than ever. Learn more about what’s happening in your world with data around COVID-19 Vulnerability, Vaccinations, and Hospitalizations.

In this blog, we highlight frequently updated wildfire and drought data layers. Whether or not your community is directly impacted by wildfire season or drought, our climate data can help you stay safe and spur positive community resilience.