Will you survive the Zombie Apocalypse?!
Can you survive the Zombie Apocalypse? Using the Map Room, chart your route to the nearest hospital, supermarket, drug stores, and warehouse stores to ensure you can get supplies. Find out how!

Can you survive the Zombie Apocalypse? Using the Map Room, chart your route to the nearest hospital, supermarket, drug stores, and warehouse stores to ensure you can get supplies. Find out how!

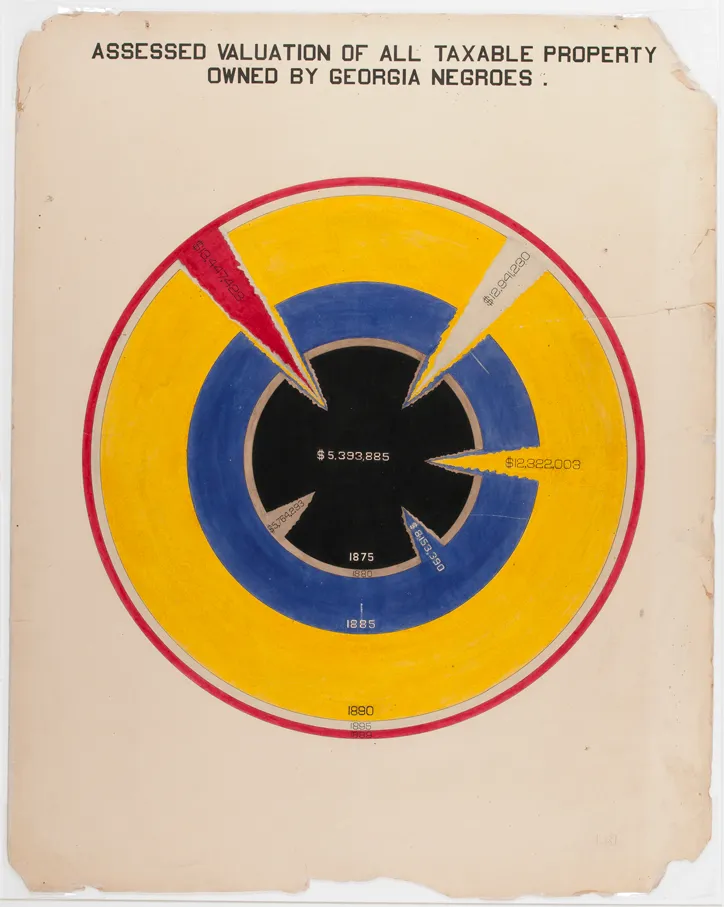
In this blog we discuss history of data visualization with a particular focus on the fascinating work of W.E.B. Du Bois.

Commuting to work has significant impacts on personal health, the environment, and the economy. Learn more with SparkMap data in this blog!

The US Census Bureau has undergone changes in their demographics questions. Why are these changes needed, how do they demonstrate the changing population of America, and what can we do with this information? Find out in our blog!

Learn how to use the Select Data tool in the Map Room to see data in context of a specific region or distance from a point. In this example, we’ll look at the data for 501(c)(3)s and (c)(4)s that are within 1 mile of an address.

People with Type 1 and Type 2 diabetes are more likely to develop serious cases of COVID-19, including hospitalization, than those who don’t have diabetes. But, how can healthcare providers identify those with diabetes and determine strategies to support them? SparkMap can help!